View similar
Share on Pinterest

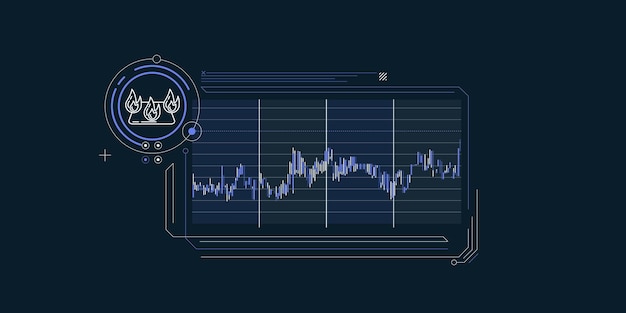
The graph concisely and simply reflects price changes in the natural gas market vector illustration
Related tags
- finance infographic
- infographic presentation
- business chart
- stock
- trading
- stock trading
- procedure
- 23+
- graph
- business graph
- data graph
- development process
- report
- analytics
- chart
- demand
- diagram
- infographic
- design process
- business infographic
- petroleum
- data infographic
- chart design
- gas
- finance
- business finance
- exchange
- investing
- symbol
- business report
- Show less