open
Home
Projects
AI Suite
AI Assistant
New
AI Image Generator
AI Video Generator
Image upscaler
Retouch
Reimagine
Background Remover
Expand
AI Photo Editor
Video Upscaler
Lip Sync
Sound Effects
Video Editor
Sketch to Image
Mockup Generator
Designer
AI Icon Generator
Text to speech
All Tools
Stock
Vectors
Photos
Illustrations
Icons
Templates
Mockups
3D
Videos
Audio
New
Fonts
PSD
Explore all images
More
Our squad
Magnific
Slidesgo
Enhanced solutions
API for Developers
Sell content
Apps and plugins
Freepik for Figma
Figma Plugin
iOS
Android
Close menu
Pricing
Freepik
Search by image
Search
Pricing
Premium
AI-generated
This resource was generated with
AI
. You can create your own using our
AI Image Generator.
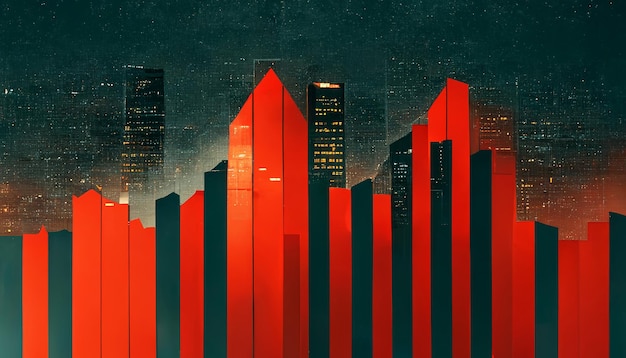
A bar chart displaying changes in corruption levels over time according to the index
VisualCreative1
You might also like these photos
Premium
Premium
Premium
Premium
Premium
Premium
Premium
Premium
Premium
Premium
time
data
visual
chart
global
levels
comparison
generated
changes
statistics
trends
corruption
index
ai
ai generated